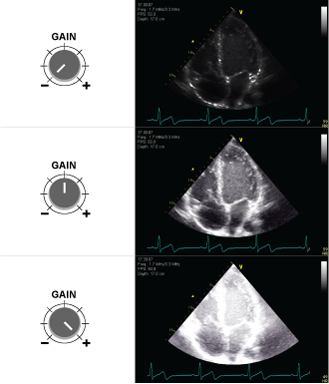
The image shows an ultrasound image of the heart with different gain settings. The top image is undergained, the middle has optimised gain, and the bottom image is overgained.
Undergain If the user sets the gain control too low, the result is that the amplification of the electrical signals becomes too small and the 2D grayscale image on the screen becomes too dark.
Overgain If the user sets the gain control too high, the result is overamplified electrical signals including artefactual noise and the 2D greyscale image becomes too bright (white) with loss of resolution.
This ends the lesson on ‘Understanding Ultrasound’
Before you can start the next lesson you must test yourself in a little quiz – results are for you only. Nothing will be stored.
The image on the ultrasound monitor represents a thin slice of tissue.
The size of the slice is determined by the profile of the ultrasound beam and can be described by height, width and thickness.
The ultrasound beam thickness is approximately 3-8 mm.
The width in the proximal part of the image is determined by the width of the footprint of the transducer. The width in the distal part of the image can be changed when using curved transducers – this is most often not needed in focused emergency ultrasonography.
Height can be changed by adjusting the image depth on the ultrasound system.
Moving the transducer on the surface of the skin, rotating and tilting the transducer allows you to capture the best possible cross-sectional view of your target structure in the best possible position.
Reflection
Ultrasound imaging is based on echoes of transmitted sound waves.
The more a structure reflects the sound waves, the whiter the structure appears on the screen.
An-, hypo- and hyperechoic
Some structures are great reflectors of ultrasound waves and appear bright white (hyperechoic) on the ultrasound screen.
Other structures reflect only little and appear hypoechoic (gray).
Air, fluid, blood all appear anechoic (black) which means there is no reflection at all.
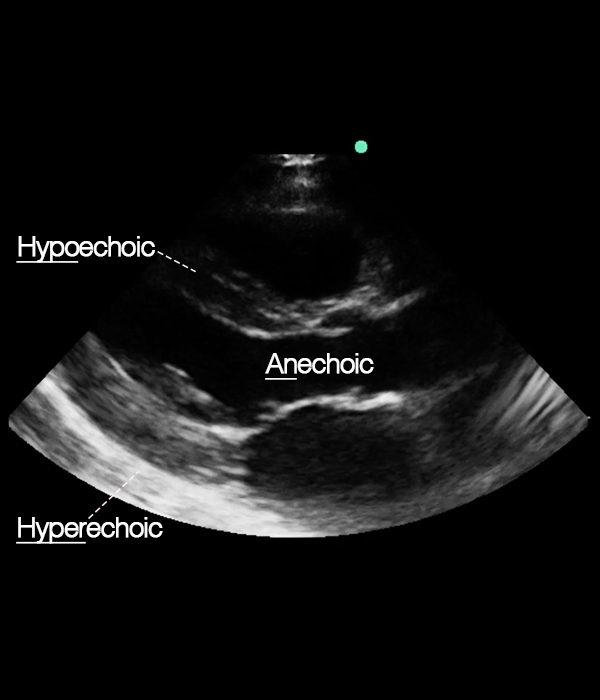
Parasternal long axis view with examples of an-, hypo- and hyperechoic structures.Anechoic: blood
Hypoechoic: interventricular septum
Hyperechoic: pericardium
The image is generated by the transducer and the ultrasound system and displayed on the screen.
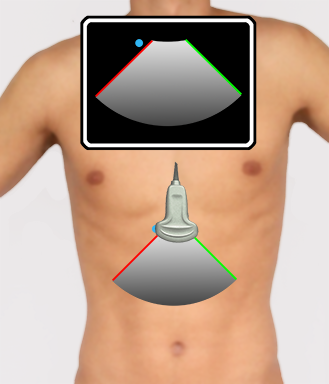
The sector is demarcated by the two radii and the arc. In the illustration below, the two radii of the sector are red and green.
The red and the green radii diverge from the probe at the top of the monitor (the skin surface).
By convention, the orientation indicator (OI – blue dot on the screen) is on the left side of the screen in conventional clinical ultrasound applications (it is the opposite in cardiac ultrasound, where the OI is placed on the right side of the screen).
When orienting the orientation marker (OM – blue dot on the transducer) to the same side as the OI on the screen, the red radius of the ultrasound beam sector corresponds to the red radius of the ultrasound image sector, and the green radius corresponds to the green radius of the ultrasound image sector.
The image shows the ultrasound sector produced by the probe and the corresponding ultrasound image on the ultrasound screen. Notice that the OM on the left side of the transducer corresponds to the left side of the screen. The right side of the ultrasound sector (green) corresponds to the right side (also green) of the screen.
The OM facilitates the correct orientation of the transducer when scanning the patient.
The OM has to be oriented correctly with the corresponding orientation indicator (OI) on the monitor.
When in doubt use the “finger-on-transducer” test explained in the video below – press the PLAY triangle to watch the video
The video-clip shows the “finger-on-transducer” test – touching of the left side of the transducer is displayed as a movement in the ultrasound image on the left side of the screen when the probe is oriented correctly.
A shared terminology to describe the movement of the transducer during scanning is important in order to optimize the image.
During the workshop it makes it easier for the supervisor to give instructions without touching the transducer which is crucial for the novice in order to achieve practical skill.
There are many available descriptions of the method of manipulation of the transducer.
We recommend using:
1. rotate (right – clockwise, left – counterclockwise)
2. rock (in-plane motion away or toward the indicator)
3. tilt (angling the transducer – perpendicular to rocking)
– sweep (is tilting with a continuous fanning motion back and forth)
4. slide (moving the transducer on the skin)
As a novice you should only manipulate the transducer in one direction at a time.
Figure showing movements in three different spatial directions. Confused? Look at the video in the next topic!
Imaging
Ultrasonography is an imaging method based on ultrasound.
Ultrasonography uses the impulse-echo principle of generating and emitting short pulses of ultrasound that are reflected at tissue interfaces and subsequently recorded by the receiver.
The reflected sound wave is essential for the production of the ultrasound images.
The illustration shows the emission of sound from the transducer and reflection of the signal at tissue interfaces. The ultrasound waves that hit an interface, here a bone, reflect the ultrasound. The waves that do not hit anything do not generate any echo.
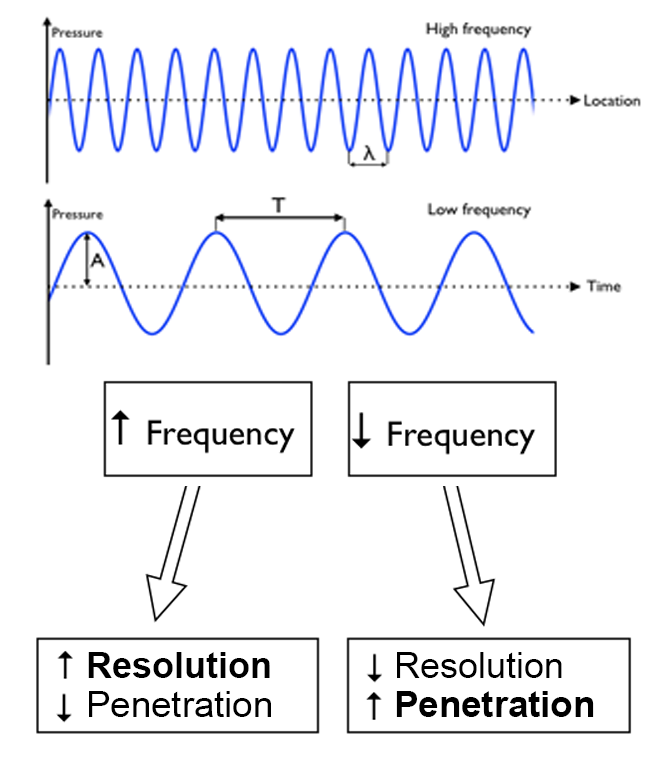
Frequency
The frequency of a sound wave is equal to the number of wave tops per time unit.
The SI unit for frequency is Hertz (Hz) = wave tops pr second.
Ok, so that does not sound simple…
This is what you need to know:
The longer the distance the sound wave travels, the more energy is lost to absorption.
The ability of a sound wave to penetrate through tissue depends on the frequency of the sound wave – a lower frequency (lower number of wave tops) gives a better penetration.
On the other hand, a higher frequency (more wave tops) causes a higher resolution, but a lower penetration.
A systematic approach will facilitate successful scanning:
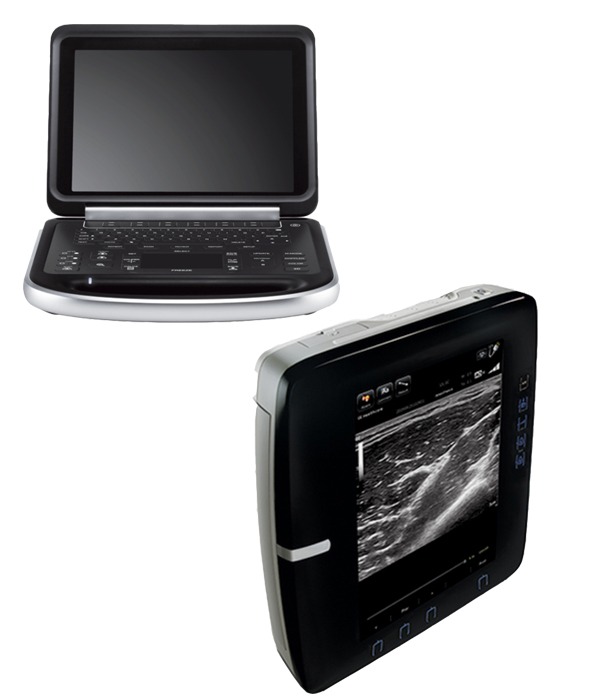
• Ensure a power supply for the procedure – either a connection to a network voltage, or sufficient battery capacity
• Turn on the ultrasound system • Select your transducer • Choose preset (predefined setting appropriate for a specific examination)
• Obtain view
• Adjust the depth setting
• Adjust the gain setting
• Interpret the findings