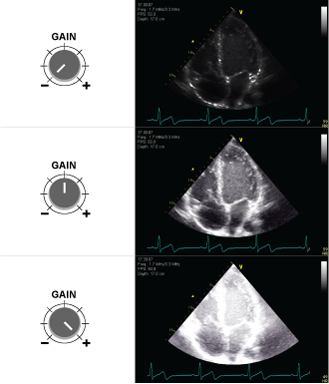
The image shows an ultrasound image of the heart with different gain settings. The top image is undergained, the middle has optimised gain, and the bottom image is overgained.
Undergain If the user sets the gain control too low, the result is that the amplification of the electrical signals becomes too small and the 2D grayscale image on the screen becomes too dark.
Overgain If the user sets the gain control too high, the result is overamplified electrical signals including artefactual noise and the 2D greyscale image becomes too bright (white) with loss of resolution.
This ends the lesson on ‘Understanding Ultrasound’
Before you can start the next lesson you must test yourself in a little quiz – results are for you only. Nothing will be stored.
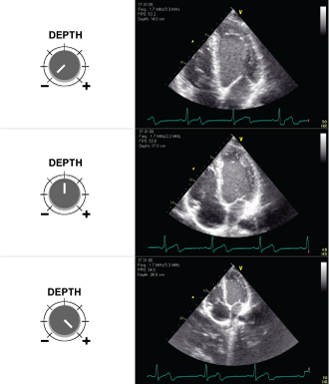
Depth should be optimised to target the structure of interest in the centre of the monitor and to visualise the entire target structure inside the visual field.
The image shows an ultrasound image of the heart with different depth settings. The top image is too shallow, the depth of the middle image is appropriate, and the depth of the bottom image is too large.
Every artist has their tools. In ultrasonography, it’s all about knowing your machine and mastering ‘Knobology’. This refers to the art of tweaking various settings to get the perfect image.
Tip: Familiarize yourself with the user controls on your specific ultrasound system, so you can optimise the ultrasound image in order to improve the added diagnostic value of the images.Every machine might have its quirks, but the principles remain consistent.
The most important user controls are:
Depth
Gain
Focus
which will be explained below.
Depth – keep all relevant details in the image
Imaging depth is quite straightforward – it dictates how deep you can peek into the body with your ultrasound machine.
Measurement: Depth is gauged in centimeters and kicks off from the surface of the transducer, typically positioned on the patient’s skin.
Case-based decision: Your desired imaging depth isn’t a one-size-fits-all. It varies based on the specific case and the structure under examination. For instance, in vascular ultrasound, the focus is often on more superficial arteries and veins. Here, the required depth might only span a few centimeters, heavily influenced by factors like the patient’s physique and the particular vessel being observed. However, for deeper organs like the heart and spleen, you’ll need to dial up the depth to ensure a clear view on the screen.
The image shows an ultrasound image of the heart with different depth settings. The top image is too shallow, the depth of the middle image is appropriate, and the depth of the bottom image is too large.
Gain – the art of image brightness
Too bright or too dark? That’s where gain come in. It’s like adjusting the brightness on your TV. But, with ultrasonography, precision is key.
Undergain: Setting the gain too low dims the lights on your image. This makes the image too dark, causing potential loss of detail.
Overgain: Over-enthusiastic with the gain? Your image might become too bright, like an overexposed photo, causing loss of resolution.
Balancing undergain & overgain: Striking the right balance is crucial. Too much or too little gain can obscure important details.
Advice: Regularly practice adjusting the gain. With time, finding that ‘sweet spot’ of brightness becomes second nature.
The image shows an ultrasound image of the heart with different gain settings. The top image is undergained, the middle has optimised gain, and the bottom image is overgained.
Focus – sharpening the image
After setting your depth, the next crucial point is the focus. This is the point where your ultrasound scanner directs most of its attention, offering the clearest image.
Automatic setting: Most contemporary scanners autonomously set the focus point, and they’re usually on point with this task.
Marker & position: Conventionally, focus is demarcated by a tiny triangle along the image’s edge, adjacent to the depth scale. This marker informs the scanner about the image’s pivotal area, the part you desire the crispest resolution for.
When does it matter most?: Adjusting the focus becomes especially crucial when dealing with minute structures like nerves and vessels, particularly the walls of vessels. For broader structures like the liver or kidney, tweaking the focus isn’t a common clinical practice.
Bone and air do not allow ultrasound penetration. Since most of the thorax consists of bone and air it can be hard to find ‘a passage’ through which the ultrasound waves can travel to get an image of the deeper structures e.g. the heart.
Such an area of passage is called an ‘acoustic window‘.
Acoustic windows are often small with a narrow passage for the ultrasound waves.
Use this strategy when scanning:
• ‘Scout scan: ” Slide the transducer with large movements over the skin, and look for target structure. Then use smaller movements to place the transducer on the acoustic window
• Optimize the view by rocking, rotating or tilting the transducer
• If the image disappears then start again by finding the acoustic window (sliding) before trying to optimize
If you have not found an acoustic window you will not gain anything by rocking, tilting or rotating the transducer, just like tilting your head will not help you look through a door – you need to find the keyhole first.
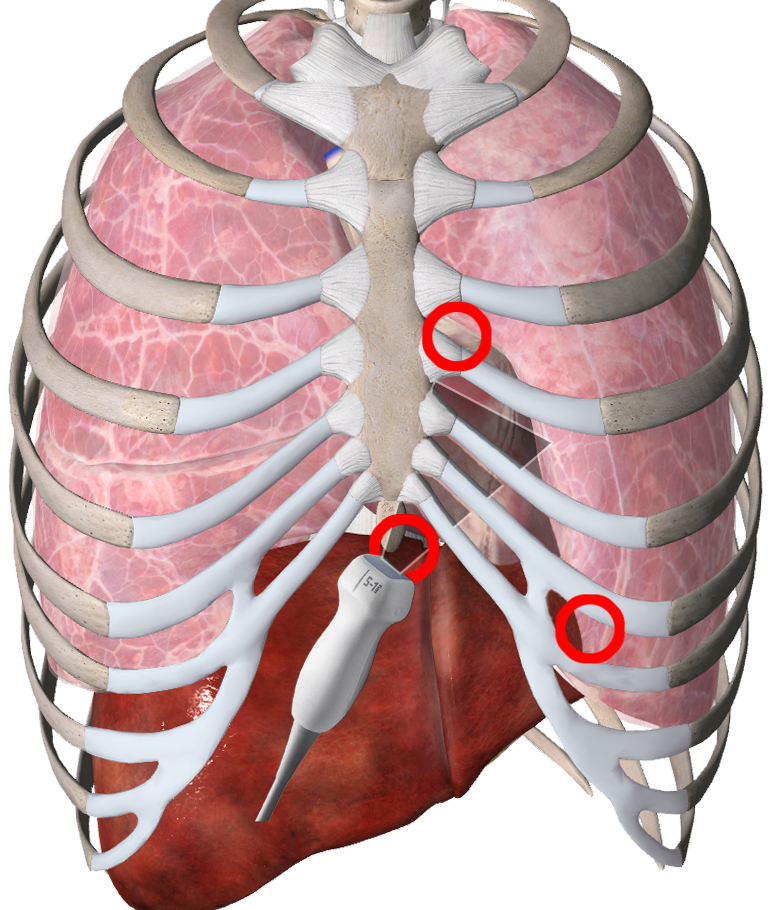
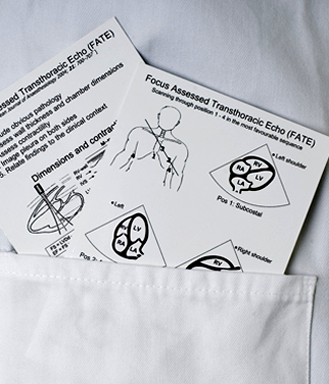
Image showing three common acoustic windows: the parasternal area, the subcostal area and the apical area.
To ensure maximum transmission of ultrasound into the tissue, the application of ultrasound gel is very important.
Remember always to use a sufficient amount of gel.
The video shows two different ultrasound images of the same blood vessel at the wrist in the same patient, when sufficient and insufficient amounts of ultrasound gel is used. In the upper image the probe is placed on a “dry” arm, and in the lower image a sufficient amount of gel was used.
Obtaining the ultrasound image on the ultrasound system is done by
finding the relevant ‘acoustic window‘
using ultrasound gel to ensure good acoustic coupling
manipulating the transducer correctly
These conditions are explained in detail below.
Acoustic window
Bone and air do not allow ultrasound penetration. Since most of the thorax consists of bone and air it can be hard to find ‘a passage’ through which the ultrasound waves can travel to get an image of the deeper structures e.g. the heart.
Such an area of passage is called an ‘acoustic window‘.
Acoustic windows are often small with a narrow passage for the ultrasound waves.
Use this strategy when scanning:
“Scout scan“: Slide the transducer with large movements over the skin, and look for the target structure. Then use smaller movements to place the transducer on the acoustic window
Optimize the view by rocking, rotating or tilting the transducer
If the image disappears then start again by finding the acoustic window (sliding) before trying to optimize
If you have not found an acoustic window you will not gain anything by rocking, tilting or rotating the transducer, just like tilting your head will not help you look through a door – you need to find the keyhole first.
Image showing three common cardiac acoustic windows: the parasternal area, the subcostal area and the apical area.
Acoustic coupling – the importance of ultrasound gel
To ensure maximum transmission of ultrasound into the tissue, the application of ultrasound gel is very important.
Remember to always use a sufficient amount of gel.
The video shows two different ultrasound images of the same blood vessel at the wrist in the same patient, when sufficient and insufficient amounts of ultrasound gel is used. In the upper image the probe is placed on a “dry” arm, and in the lower image a sufficient amount of gel was used.
Manipulating the transducer
A shared terminology to describe the movement of the transducer during scanning is important in order to optimize the image.
During the workshop it makes it easier for the supervisor to give instructions without touching the transducer which is crucial for the novice in order to achieve practical skill.
There are many available descriptions of the method of manipulation of the transducer.
We recommend using:
1. rotate (right – clockwise, left – counterclockwise)
2. rock (in-plane motion away or toward the indicator)
3. tilt (angling the transducer – perpendicular to rocking) – sweep (is tilting with a continuous fanning motion back and forth)
4. slide (moving the transducer on the skin)
As a novice you should only manipulate the transducer in one direction at a time.
Figure showing movements in three different spatial directions. Confused? Look at the video below.
The OM facilitates the correct orientation of the transducer when scanning the patient.
The OM has to be oriented correctly with the corresponding orientation indicator (OI) on the monitor.
When in doubt use the “finger-on-transducer” test explained in the video below – press the PLAY triangle to watch the video
The video-clip shows the “finger-on-transducer” test – touching of the left side of the transducer is displayed as a movement in the ultrasound image on the left side of the screen when the probe is oriented correctly.
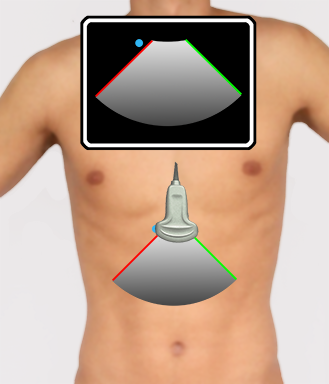
The image is generated by the transducer and the ultrasound system and displayed on the screen.
The sector is demarcated by the two radii and the arc. In the illustration below, the two radii of the sector are red and green.
The red and the green radii diverge from the probe at the top of the monitor (the skin surface).
By convention, the orientation indicator (OI – blue dot on the screen) is on the left side of the screen in conventional clinical ultrasound applications (it is the opposite in cardiac ultrasound, where the OI is placed on the right side of the screen).
When orienting the orientation marker (OM – blue dot on the transducer) to the same side as the OI on the screen, the red radius of the ultrasound beam sector corresponds to the red radius of the ultrasound image sector, and the green radius corresponds to the green radius of the ultrasound image sector.
The image shows the ultrasound sector produced by the probe and the corresponding ultrasound image on the ultrasound screen. Notice that the OM on the left side of the transducer corresponds to the left side of the screen. The right side of the ultrasound sector (green) corresponds to the right side (also green) of the screen.
Reflection
Ultrasound imaging is based on echoes of transmitted sound waves.
The more a structure reflects the sound waves, the whiter the structure appears on the screen.
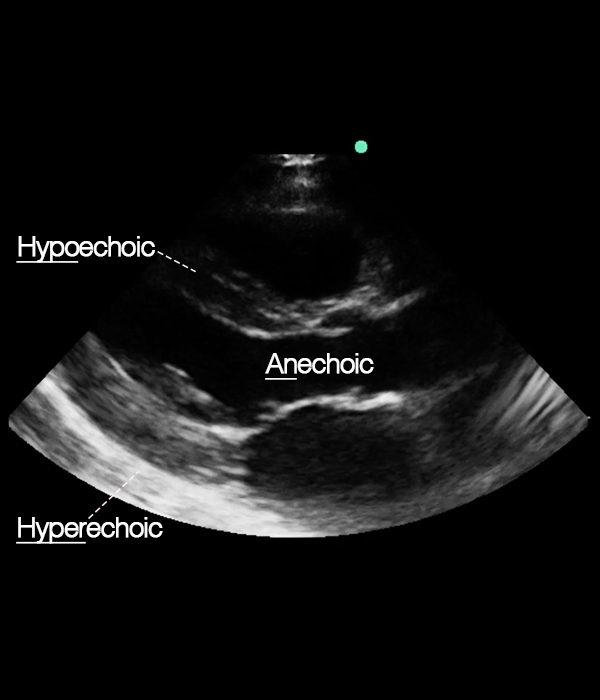
An-, hypo- and hyperechoic
Some structures are great reflectors of ultrasound waves and appear bright white (hyperechoic) on the ultrasound screen.
Other structures reflect only little and appear hypoechoic (gray).
Air, fluid, blood all appear anechoic (black) which means there is no reflection at all.
Parasternal long axis view with examples of an-, hypo- and hyperechoic structures.Anechoic: blood
Hypoechoic: interventricular septum
Hyperechoic: pericardium