Cardiac ultrasound

Tissue Doppler imaging


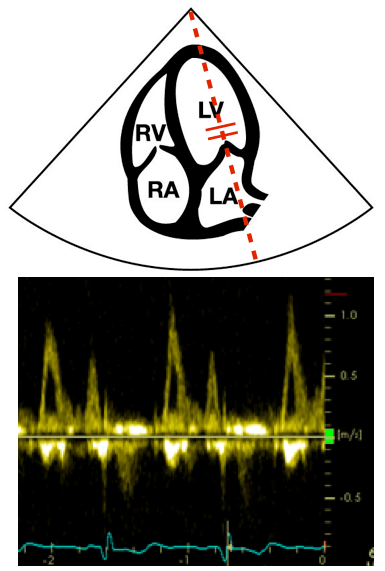
Measuring the myocardial velocities in the mitral annulus by means of tissue Doppler imaging (TDI) adds significant value to the evaluation of the left ventricular diastolic function

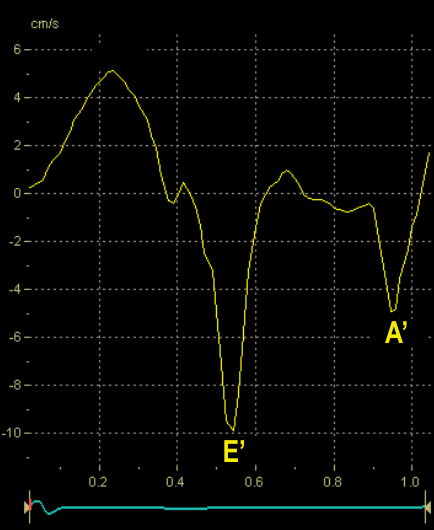
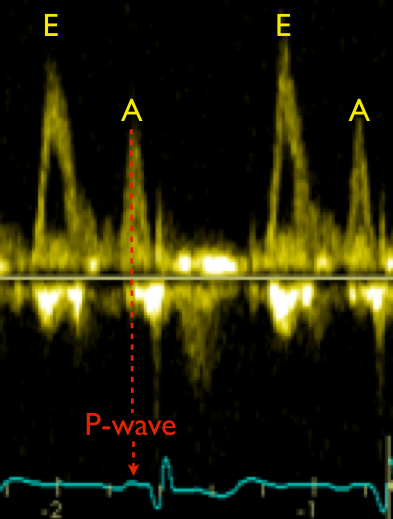
Tissue Doppler recording is characterised by two diastolic peak velocities, the E’ (E prime) as an early event and the A’ (A prime) during atrial contraction

Normally E’ > A’ with a ratio of approximately 1-2

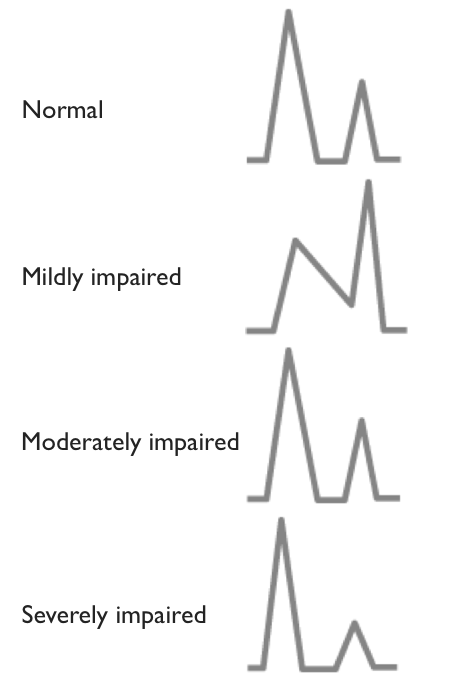
Like for the transmitral E and A, the ratio reverses progressively as diastolic dysfunction develops

Image missing
Normal tissue Doppler velocity curve recorded at the mitral annulus at the interventricular septum showing the diastolic peaks: E’ and A’

Severely impaired diastolic function


The mitral inflow curve

E/A: > 2

DT: <140 ms

Abnormal values together with increased LV myocardial thickness and/or enlarged left atrium strongly suggest severe diastolic dysfunction

Image missing
Severely impaired filling pattern
Restrictive filling pattern
Reduced relaxation and compliance
Severely increased LV end-diastolic pressure

Moderately impaired diastolic function


The mitral inflow curve

E/A: <1-2

DT: <240 ms

Abnormal values together with LV hypertrophy and increased left atrial size strongly suggest moderately impaired diastolic function

Image missing
Moderately impaired filling pattern
Pseudonormalisation
Slightly reduced relaxation and compliance
Slightly increased LV end-diastolic pressure

Mildly impaired diastolic function


The mitral inflow curve

E/A: <1

DT: >240 ms

Slightly abnormal values of diastolic mitral inflow indicate the beginning of impaired diastolic function

It is important to assess LV myocardinal thickness and left atrial size

Image missing
Mildly impaired filling pattern
Slightly reduced relaxation

Normal diastolic function


The mitral inflow curve

E: Normally higher than A, Max E ? 1.2 m/s

A: Normally smaller than E

E/A: Normal range 1-2

DT: Normal range 140-240 ms

Normal values of diastolic mitral inflow, absence of LV hypertrophy or left atrial enlargement strongly suggest normal diastolic function

Image missing
Normal filling pattern
Normal: relaxation, compliance and LV end-diastolic pressure
Normal reference values are given on the FATE card

Severity of diastolic dysfunction


Diastolic function is most often classified as:

– Normal

– Mildly impaired

– Moderately impaired

– Severely impaired

Image missing
Schematic drawing of mitral inflow curves as diastolic dysfunction increases

How to measure – 2


Deceleration time

DT = The E wave deceleration time period between the peak E and the end of the E wave where it crosses the baseline

DT changes with aging and/or disease and is thus important for the interpretation of diastolic dysfunction

Image missing
Schematic drawing of a normal mitral filling curve
The measurement of the deceleration time is displayed

How to measure – 1


The mitral inflow curve

E: Early filling, represents the passive filling, the velocity should be read at the maximum velocity

A: Atrial filling, represents the active filling during atrial contraction, the velocity should be read at the maximum velocity

E/A = The ratio between the E and A maximum velocities

Image missing
Schematic drawing of a normal mitral diastolic filling curve with E and A wave

Interpretation of the mitral diastolic inflow Doppler curve


Minimum evaluation should include:

E: Peak E (early) wave velocity

A: Peak A (atrial) wave velocity

E/A ratio

DT: The E wave deceleration time period (see page 9/34)

Image missing
Normal mitral diastolic filling curves
Notice that the A wave is synchronised with the P wave in the corresponding ECG

Step-by-step assessment of mitral inflow blood velocities


A systematic approach will help to ensure correct assessment of mitral inflow

Procedure:
1. Ensure you have a good ECG-signal
2. Display and optimise the correct 4 chamber view
3. Activate the cursor
4. Place the SV at the tip of the mitral leaflets
5. Activate PWD
6. Apply subtle movements to the transducer in order to record uniform spectral curves
7. Adjust when convenient:
– Baseline
– Scale
– Low velocity reject
– Other relevant features

Image missing
Top image: Correct placement of the sample volume
Bottom image: Corresponding PWD spectral Doppler curve